Support
|
GroupInsight Reports
GroupInsight provides aggregate reports about populations of employees within your organization based on Status Reports submitted via RSIGuard.
GroupInsight, lets you:
- Identify populations of employees based on location, department, work patterns, safety compliance, discomfort information*, etc.
- Identify factors that lead to particular discomfort risk levels*
- Report aggregate statistics on work patterns, safety compliance, and discomfort incidence* for identified populations (e.g. break taking patterns, mouse and keyboard strain exposures
- Communicate with identified populations via email to communicate solutions, training, or to automatically update RSIGuard settings
* only available with Health Status Reports (which include discomfort surveys)
GroupInsight Reports are most useful for managers and Health and Safety staff who want to identify particular injury risks,
understand employee work patterns, track success of an injury reduction program, and find and implement data-based solutions
to computer-related risk within the organization.
GroupInsight Reports are generated from up to 3 sources of information:
- Objective DataLogger data collected automatically by RSIGuard (as reported in UserInsight).
- Results from optional, periodic discomfort reports called Health Status Reports (or HSRs).
- Optional HR data that you point GroupInsight to (e.g. department, job title, supervisor, etc.)
The GroupInsight application is included in the RSIGuard Administrator Tools package.
Click here to watch a video about how to use GroupInsight or read online documentation.
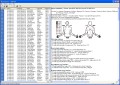
If you have installed GroupInsight,
you can click here to view some
sample report data.
What should you look for with GroupInsight Reports?
The range of what you can identify with GroupInsight is extensive, so it's important to consider what types of issues your organization has when thinking about running reports. However, here are some example conceptual reports you might run:
- Identify which departments have the lowest levels of break compliance. Talk with the managers in that department to determine if there are cultural, physical, or procedural factors that are deterring break compliance, and address the issues. Follow up with departments once a month to determine if compliance is improving.
- Determine the average mouse and keyboard strain levels in your organization. Send a bulk email (using GroupInsight) to employees with 150% or more mouse strain that discusses keyboard shortcut tips, information on proper mouse placement, and other organization-appropriate assistance. Send a bulk email to employees with 150% or more keyboard strain with tips on neutral wrist posture, keyboard placement, and a description of AutoClick. If corrective equipment is available (e.g., adjustable ergonomic keyboards), send an email to the highest keyboard strain users with an offer to update their workstation. Tell high strain users how to use features like KeyControl to reduce repetitive keyboard and mouse actions.
- Compare mouse/keyboard strain/hours (or other factors) with reported discomfort levels (if you use HSRs). Determine your organizational correlation between discomfort and these statistics (e.g. 10% of people who mouse over 4 hours per day report discomfort, while 30% who mouse over 5 hours do). Determine what your organization considers unacceptable risk and limit usage (e.g. using the Work Restrictions feature).
- Another approach to the previous report is to search for people with various discomfort profiles and view what their average usage statistics are. Compare people with one discomfort point to those with none and many. Determine what usage patterns are most associated with discomfort.
- Use GroupInsight to prioritize workstation evaluations for people with the longest or highest strain exposures, and to notify these people by email (via GroupInsight) that a workstation evaluation will be happening, e.g., in the next 6 months.
- Using the "contact requested" field and the department or location field, have an ergonomist efficiently visit contact-requesters by department/location.
- Determine average usage statistics (e.g. mouse clicks, keystrokes, typing time) to make available to employees so they can have a sense of how they compare to employee averages. Additionally, providing these statistics by department will provide an even better sense to employees about their relative risk.
- Find out if users are using ForgetMeNots, and if so, if they have the Microbreak feature enabled. If not, use GroupInsight to send emails to non-users to encourage or require use. Follow up every 90 days to see who is and isn't using ForgetMeNots/Microbreaks.
- Search for high mouse strain users who don't use AutoClick and suggest that they try AutoClick. If your organization uses HSRs, invite or require users who report discomfort to come to an AutoClick training session to increase AutoClick usage. Train this same group of people in the use of KeyControl for tasks like drag and drop/selection and double-clicking.
- Search for people whose discomfort has increased since the last report. Provide these people directed ergonomic support or medical referral to prevent an injury from worsening.
Search Tip: HSRs/ DSRs arrive periodically, but the database contains all reports ever received (although you can hide older reports). A frequent question is, "how do I report only on the latest received reports" or "how do I create averages based on all of last year". The answer to these is to use the Find by Report Details-Find by date report was filed search criteria. If you receive reports every 90 days, for example, a search for records received within the last 90 days gives you only the latest reports. You can also search for reports submitted between two specified dates to produce historical comparison reports.
Report Frequency Considerations
Status Report data is typically collected monthly, quarterly, every 6 months, or annually. Factors to consider when selecting report frequency include:
- If you use HSRs (which require users to complete the discomfort survey), space the reports far apart enough that you will not be asking employees to complete surveys unreasonably often.
- Status reports are useful because they show trends. Frequent collection will create noisier data that makes finding trends more difficult (e.g., less than 1 month is not recommended).
- Less frequent collection means it takes longer to see changes occurring (e.g., longer than 1 year is not recommended).
- If you more resources to analyze data, you might collect the data monthly or quarterly. If not, you might only collect data every 6 months or a year.
Report Storage Considerations
Status Report data can be stored on an individual's computer, on a network, on a intranet or internet web server. The decision of where to store the data is based on factors such as:
- Do you want one or multiple managers to be able to access Status Reports?
- Do users share a commonly accessible network fileserver or do they have internet access?
This issue is discussed thoroughly in the RSIGuard Program Administrators Guide.
Status Reports require about 300 bytes each. If 10,000 employees each submit quarterly Health Status Reports, then the total storage requirement would be 4 X 300 X 10,000 = 12MB/year -- a relatively insignificant amount of storage.
|
|