GroupInsight Screenshots
The following screenshots from GroupInsight show various aspects of the GroupInsight application.
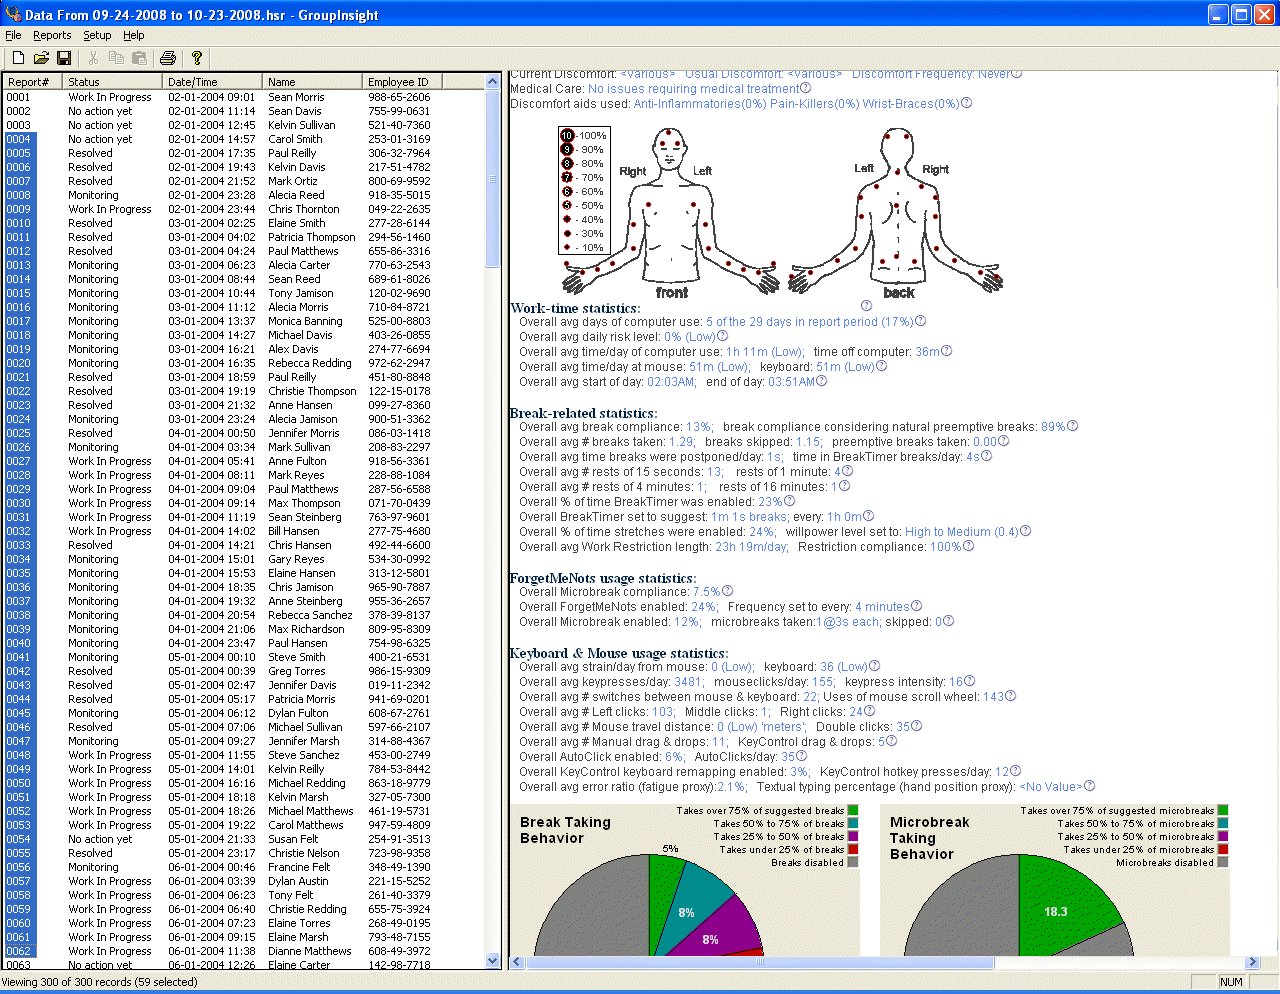
This display shows many of the HR and data columns that can be included in the list view (on the left).
This display shows an aggregate report (right) for the selected reports (left). In this example, the selected are all the users from a particular company location.
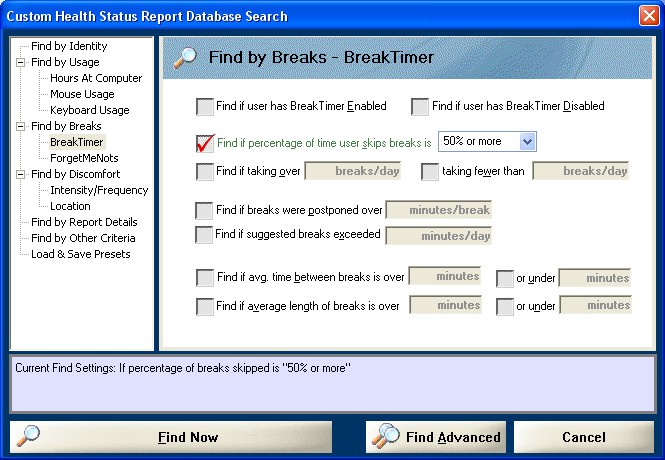
This display shows the search tool. In this case, the user is seeking a list of employees who skip more than half of their breaks.
The area on the left shows the category of search criteria, and the area to the left show particular criteria.
The purple area below that shows a plain-text explanation of what the currently specified criteria will find.
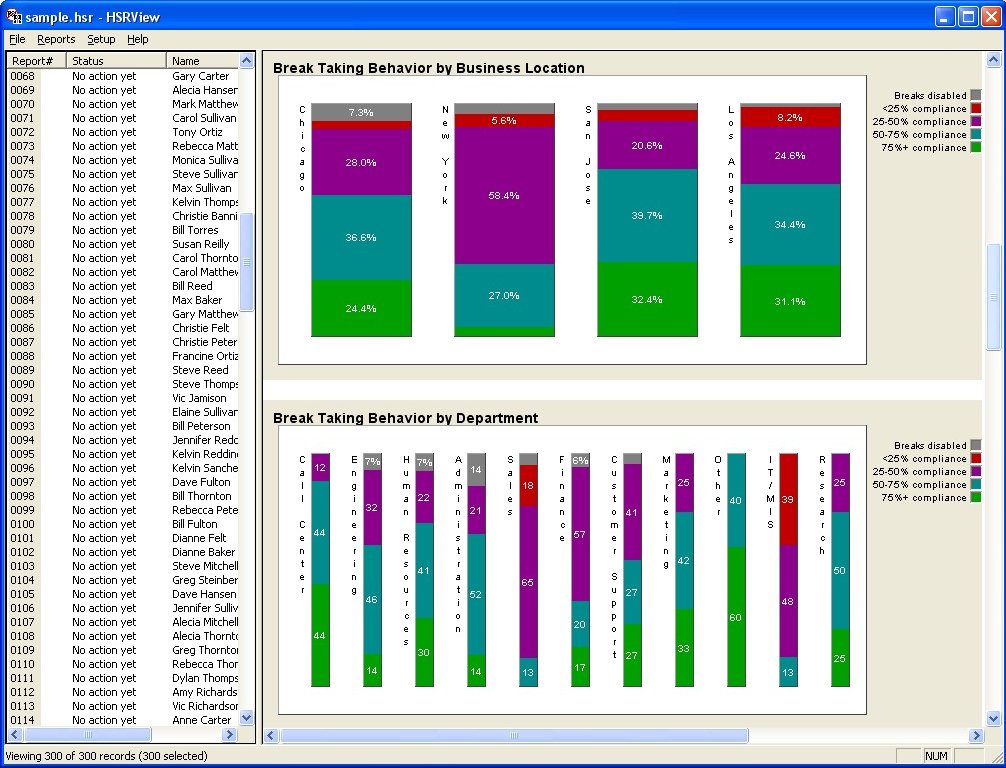
This display shows a report of break compliance by business location and by department.
| Click here to view a PDF file created with Adobe Acrobat and GroupInsight that shows discomfort and break patterns for this sample organization. |  |
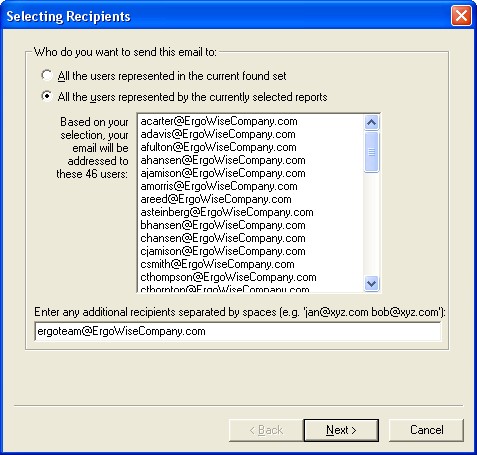
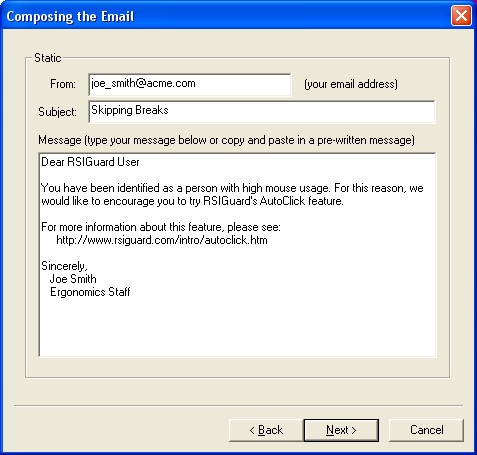
This display shows the email recipient selection and email composition pages of the bulk-email tool.
This display shows the discomfort survey that employees see when submitting a Health Status Report (HSR).
Data Status Reports automatically send the DataLogger Statistics without prompting the user for input.