The report has various sections (as described below) and each section is made up of several lines of statistics about the selected group of users.
The primary way to learn about what each statistic means
is via the context help. Each line of statistics ends in a ![]() icon. Clicking on this icon within GroupInsight brings up context help that describes the
statistics presented in detail, including how to use the statistic, and what
different ranges of values mean.
icon. Clicking on this icon within GroupInsight brings up context help that describes the
statistics presented in detail, including how to use the statistic, and what
different ranges of values mean.
Note: This document does NOT contain detailed information about each statistic. As mentioned above, to get that information, you should launch GroupInsight and view the context help for the statistic for which you want help.
Identity
 |
This section tells about who submitted a report. It includes all HR data fields and additional fields like RSIGuard version #. (If a discomfort survey was completed, results of the survey questions are included as well).
Discomfort
 |
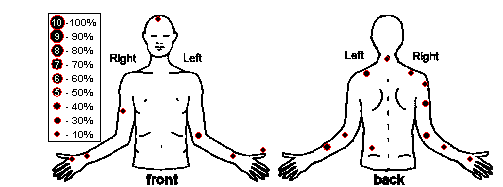
This section tells about where discomfort was reported (only available if discomfort surveys are completed). The red-bordered black dots indicate the frequency that each discomfort point was indicated. For example, if you select all users in a department, you can see what percentage of the people report discomfort in different parts of the body.
Work-time Statistics
 |
This section provides the overall computer usage, risk score, hours using the computer, keyboard & mouse.
Break-related Statistics
 |
This section provides information about prompted and unprompted break patterns as well as BreakTimer settings
ForgetMeNots and Microbreak Statistics
 |
This section tells about ForgetMeNots and microbreaks (which are part of the ForgetMeNots feature).
Keyboard and Mouse Usage Statistics
 |
This section tells about usage of the keyboard and mouse.
Comparative Graphs
 |
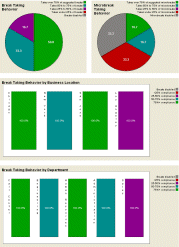
This section provides pie and bar charts that compare break taking behavior, discomfort levels (if users complete discomfort surveys), and mouse and keyboard strain, overall as well as by department and by location.